


How does Pure Pressure Vibraflex stack up against other brands?
- Mar 15
- 4 min read
Independent Testing Results for Pure Pressure Vibraflex Materials
Around July 2025 a recent round of independent testing evaluated a wide range of automotive vibration damping materials to measure their ability to reduce panel resonance and control vibration over time. The testing was conducted by independent tester Chris Purdue @ The Deadening Facebook Group, who evaluated 34 different products using the same test procedure and measurement equipment.
Three materials from Pure Pressure were included in the testing:
Vibraflex 225
Vibraflex 190
Vibraflex 155
In this round of testing, Vibraflex 225 achieved the highest overall score among all products tested.
Test Methodology
The testing focused on two key aspects of vibration damping performance:
Reduction of resonance amplitude at the panel’s natural resonant frequency
Reduction of vibration over time after an impulse
To capture both characteristics, three measurements were taken for each product:
Peak resonance amplitude reduction
Amplitude reduction after 50 milliseconds
Amplitude reduction after 100 milliseconds
These three measurements were combined into a composite score used to rank the materials. This scoring method accounts for both initial resonance suppression and the ability of the material to dampen vibration over time.
All Vibraflex measurements were taken with the test environment stabilized at 82°F (27.8°C). Because temperature can influence damping performance, these results should not be directly compared with earlier tests conducted at different temperatures.
Vibraflex Performance Results
Vibraflex 225
Measured reductions:
Resonance amplitude reduction: 18.29 dB
Reduction after 50 milliseconds: 22.31 dB
Reduction after 100 milliseconds: 41.66 dB
Composite score: 82.26
Vibraflex 190
Measured reductions:
Resonance amplitude reduction: 16.69 dB
Reduction after 50 milliseconds: 20.45 dB
Reduction after 100 milliseconds: 37.73 dB
Composite score: 74.87
Vibraflex 155
Composite score: 65.14
Detailed individual measurements for Vibraflex 155 were not included in the notes provided but were used as part of the composite score.
Overall Ranking Results
A total of 34 materials were evaluated in this round of testing. The top results were:
Pure Pressure Vibraflex 225 — 82.26
Pure Pressure Vibraflex 190 — 74.87
Resonix Mega — 72.39
Pure Pressure Vibraflex 155 — 65.14
Sundown — 64.21 (bitumen-based product, now discontinued)
Resonix CLD Squares — 62.40
NVX Ultra Thick — 59.75
Harmony — 57.80
Vibrofiltr 3 mm — 56.44
Stinger Expert — 53.20
Heat Resistance Testing
Vibraflex 225 was also evaluated for heat resistance.
The material remained stable at temperatures up to 325°F (163°C), which was the highest temperature used during the test procedure. This temperature is significantly higher than temperatures typically experienced inside vehicle body panels during normal operation, showcasing Vibraflex's stability when installed correctly.
Understanding the Measurements
Peak resonance amplitude reduction indicates how much the material reduces the panel’s natural vibration.
50 ms and 100 ms decay measurements show how quickly vibration energy dissipates after the panel is impacted. Materials that maintain lower vibration levels over time help reduce sustained rattling and resonance.
The composite score combines these three measurements to provide a single ranking value that reflects both initial resonance reduction and sustained damping performance.
Summary
Independent testing measured the ability of multiple vibration damping materials to reduce resonance and control vibration decay over time.
Key results from this round of testing include:
Three Vibraflex materials from Pure Pressure were evaluated: Vibraflex 225, Vibraflex 190, and Vibraflex 155.
Vibraflex 225 achieved the highest composite score among the 34 tested products.
Vibraflex 190 ranked second overall.
Vibraflex 155 ranked fourth overall.
Vibraflex 225 remained stable during heat testing up to 325°F, the highest temperature used in the test.
Additional documentation from the testing process, including frequency response charts, waterfall plots, and physical measurements such as thickness and weight, may be published as more data becomes available - please join and follow along by finding the facebook group "The Deadening"


Understanding the Test Graphs
Three measurements were used to evaluate how each material controls vibration.
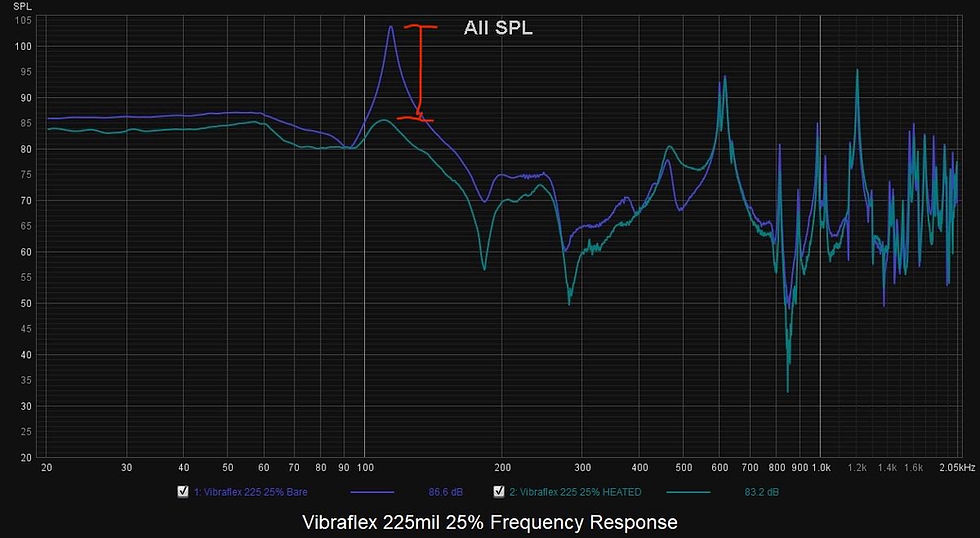
Frequency Response (All SPL)
The frequency response graph shows how much the panel vibrates at different frequencies.
Metal panels have a natural resonant frequency, where vibration is strongest. In this test setup the main resonance occurs around 90–110 Hz.
On the graph:
The bare panel shows a large peak at the resonant frequency.
After damping material is applied, the peak is reduced.
The size of this reduction shows how much the material lowers the panel’s resonant vibration.
50 Millisecond Measurement
This measurement shows the vibration level 50 milliseconds after the panel is excited.
It indicates how quickly vibration begins to decay after the initial impulse.
Lower amplitude at this point means the material is reducing vibration more quickly.
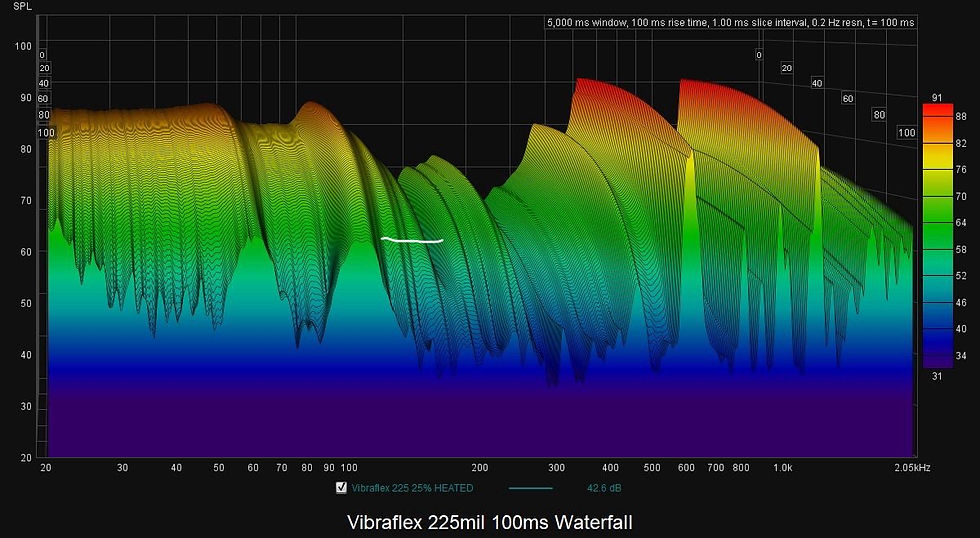
100 Millisecond Measurement
This measurement shows the vibration level 100 milliseconds after the impulse.
It indicates how much vibration remains over time.
Lower amplitude at 100 ms means the material is more effective at preventing the panel from continuing to resonate.
Why Three Measurements Are Used
The test includes:
Peak resonance reduction
Amplitude at 50 milliseconds
Amplitude at 100 milliseconds
The final score combines these three measurements to reflect both initial resonance reduction and vibration decay over time.
Link to data post:

Comments